
COLUMN - One of the most difficult parts of investing is starting out. When you take the plunge and add your lump sum to the market, you tend to watch the market prices daily and see how much you are up or down.
At the end of year 1, you reflect: "The long-term average is 10%, why didn't I get the 10%?"
I explain to clients it takes time get used to the nature of market returns. When you understand how the stock market generates returns, you tend to check your portfolio less often.
The chart shows the return on the JSE All Share Index over the past 57 years grouped into return brackets.
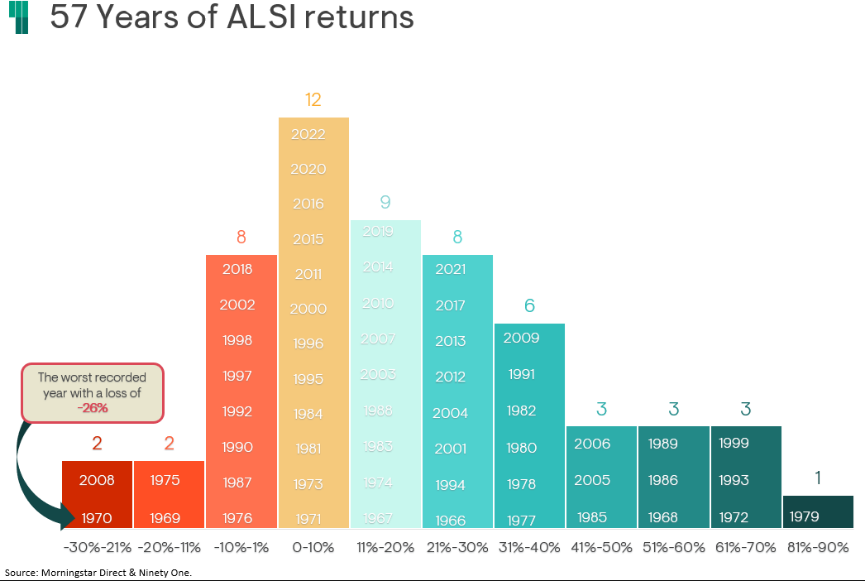
Some observations:
- In 1979, the JSE returned between 81% and 90%.
- In only 12 years out of the 57 years, the JSE delivered returns of between 0% and 10%.
- The worst years for the JSE were 1970 and 2008, when it delivered returns between -20% and -30%.
A key conclusion we draw from this type of chart is the skewness of returns on the JSE (which holds for markets in general). In 79% of the past 57 years, the JSE delivered positive returns. And not only positive returns, but excessively positive returns.
I took these numbers down in Excel and made a table of my own to show the percentage of time the JSE generated different levels of returns:
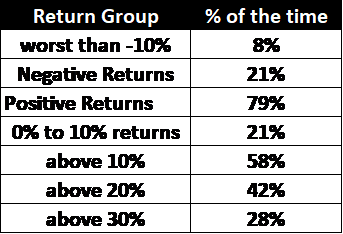
- Only 8% of the time did the JSE have returns lower than 10%.
- 79% of the time the JSE delivered positive returns.
- 58% of the time the JSE delivered returns more than 10%.
- 42% of the time the market returned more than 20% in a year.
- 28% of the time the market was up more than 39%.
On that last point - the market was up more than 30% for more years than all the down years combined.
I found a similar chart of the market returns on the US stock market. Interestingly, it looks very similar to the chart above on the JSE:
Chart: Returns on the S&P500 by different return buckets 1926 - 2020

What's most interesting is that by far the most returns over the past 95 years have fallen in the 10% to 20% range. The long-term average on the S&P is closer to 9%.
The message I draw from these charts is that stock market returns are lumpy. They don't come in a straight line (returns only come in a straight line when you put money into a fixed deposit in a bank).
Sure, sometimes there are stock market calamities (the COVID-19 crash, the Global Financial Crisis, the Dotcom bubble), but these happen seldomly. In fact, the best years often follow the worst.
Have a look at the below headline as an example –
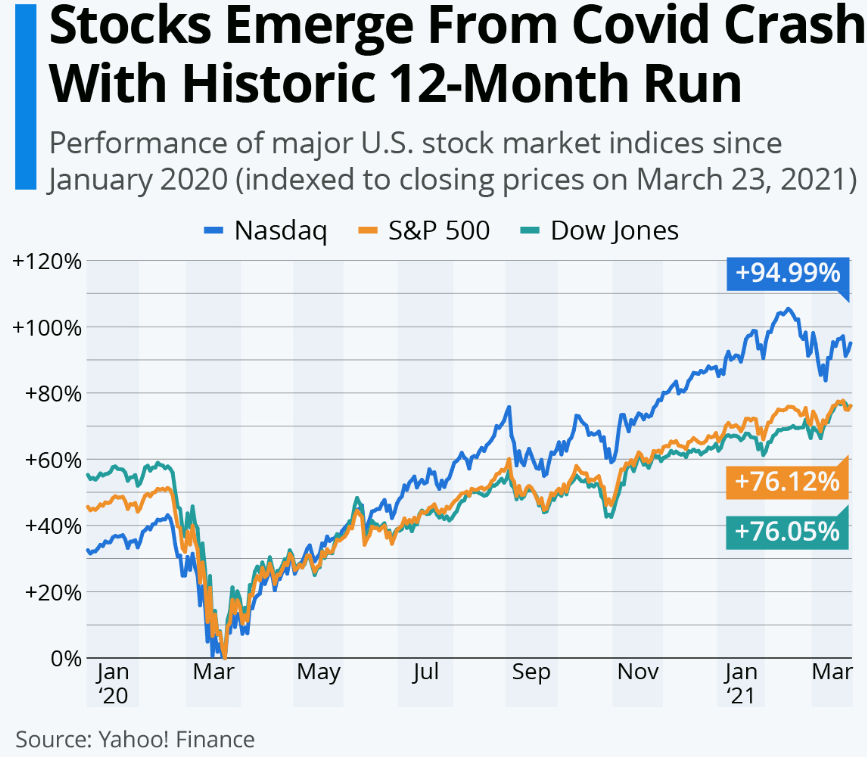
Unfortunately for investors, it's never been easier to get caught up in the short-term movements of the stock market. Prices can fluctuate wildly, and we are emotional creatures.
That's why it's important to focus on the long-term and let data and investment goals drive our decisions. If you stay invested for the long haul, you're more likely to come out ahead.

Matthew Matthee has a wealth management business that specialises in retirement planning and investments. He writes about financial markets, investments, and investor psychology. He holds a Masters Degree in Economics from Stellenbosch University and a Post Graduate Diploma in Financial Planning from UFS. [email protected]
‘We bring you the latest Garden Route, Hessequa, Karoo news’